Tuesday, 23 June 2026
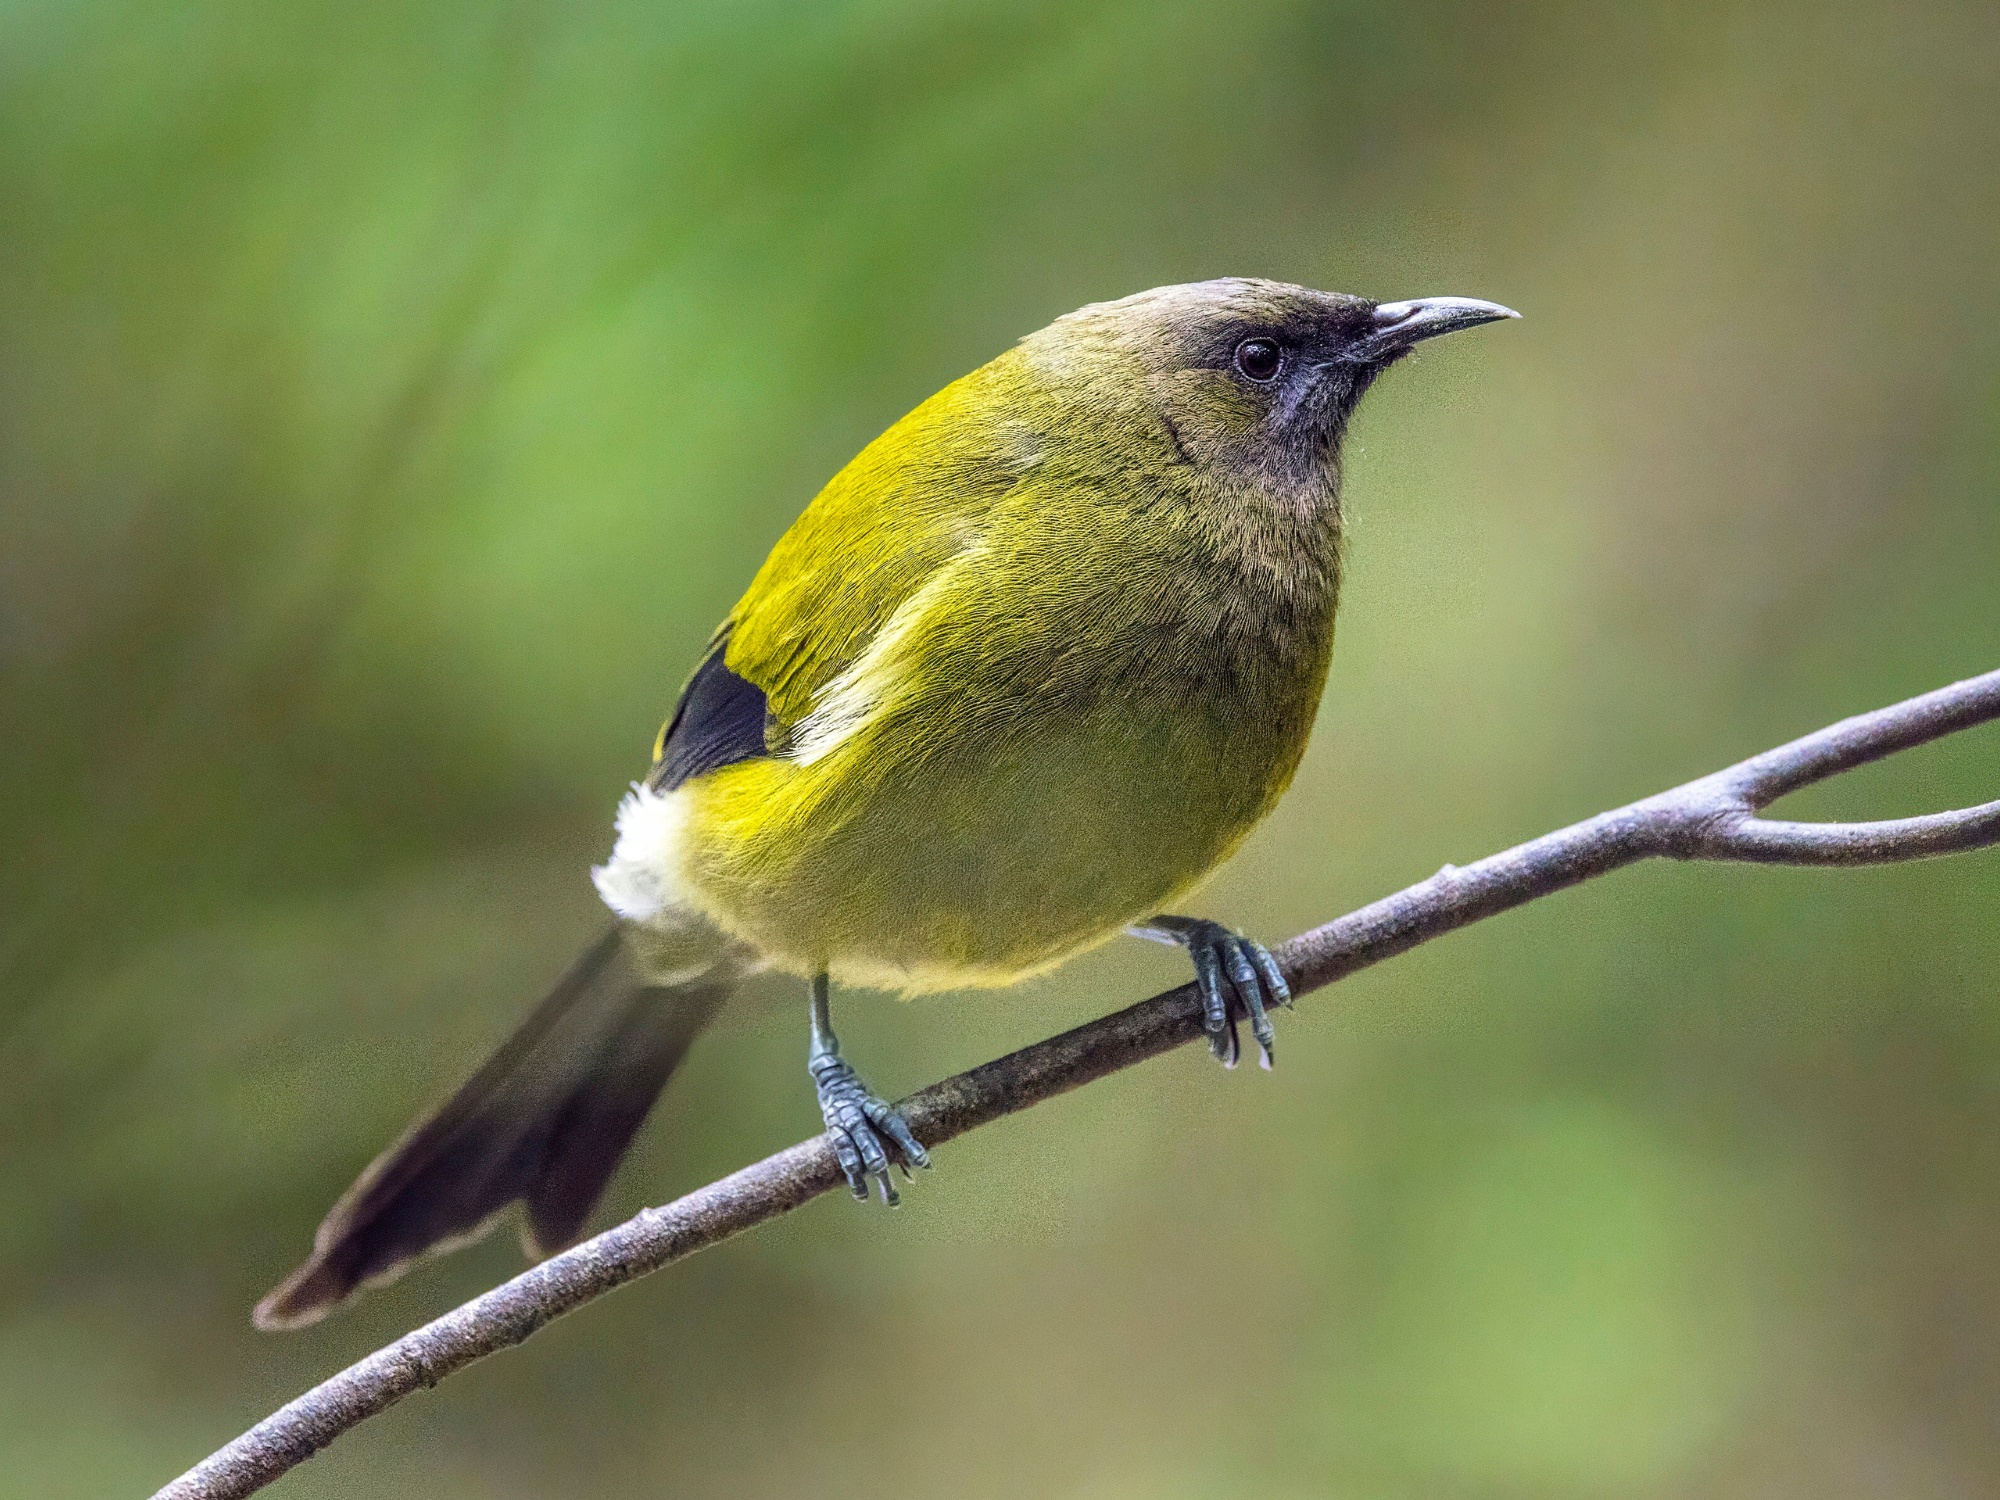
Bellbird | korimako. Image: Charles J. Sharp, CC BY-SA 4.0, via Wikimedia Commons
As Aotearoa/New Zealand’s longest-running citizen science project, the Survey has become an important tool to track how our native and introduced birds are faring both in urban and rural areas. These birds act as backyard barometers – telling us about the health of the environment we live in.
It’s the 20th year that survey data have been collected. Since the Survey was founded in 2007 by Dr Eric Spurr, more than 84,000 responses have been sent in by keen citizen scientists across the country.
This year the Survey is being undertaken by the Bioeconomy Science Institute Maiangi Taiao in collaboration with the Department of Conservation and its Always Be Naturing campaign.
Department of Conservation Predator Free Manager Pim de Monchy encourages all New Zealanders, young and old, to take part in the Survey as an easy and fun way to get naturing. “Predator Free isn’t just about trapping. It’s also about connecting with nature, taking note of what you see and playing an important role in helping understand how birdlife is doing. The survey will hopefully spark more conversations about Predator Free 2050 and what we can all do to help get there.”
The data that people submit are analysed by ecologists at the Bioeconomy Science Institute, led by Senior Researcher Dr Angela Brandt, and written up as the State of NZ Garden Birds report.
Results from the 2025 report, says Angela, are encouraging for two of our native bird species. “For the first time, silvereye (tauhou) counts show a slow increase nationally over the past 5 years and the past 10 years, and for the first time bellbird (korimako) counts are showing a slow increase over the past 5 years.
“On the other hand, it’s not quite such good news for kererū at the moment, which the 2025 survey suggests are experiencing a short-term moderate decline in numbers. This is a trend that we should keep an eye on – fingers crossed that more will be seen by survey participants around the country this year,” says Angela.
As well as being a great opportunity to connect with nature and give yourself a wellbeing boost, it’s very easy to take part in the Survey:
- Visit the NZ Garden Bird Survey website for instructions and to print off a tally sheet.
- Select a garden or a local park.
- Choose any ONE day between 27 June and 5 July.
- Look and listen for birds on that day for ONE hour.
- For each species, record the HIGHEST number seen or heard at one time in that hour.
- Submit your results online via the NZ Garden Bird Survey website’s Take Part page.
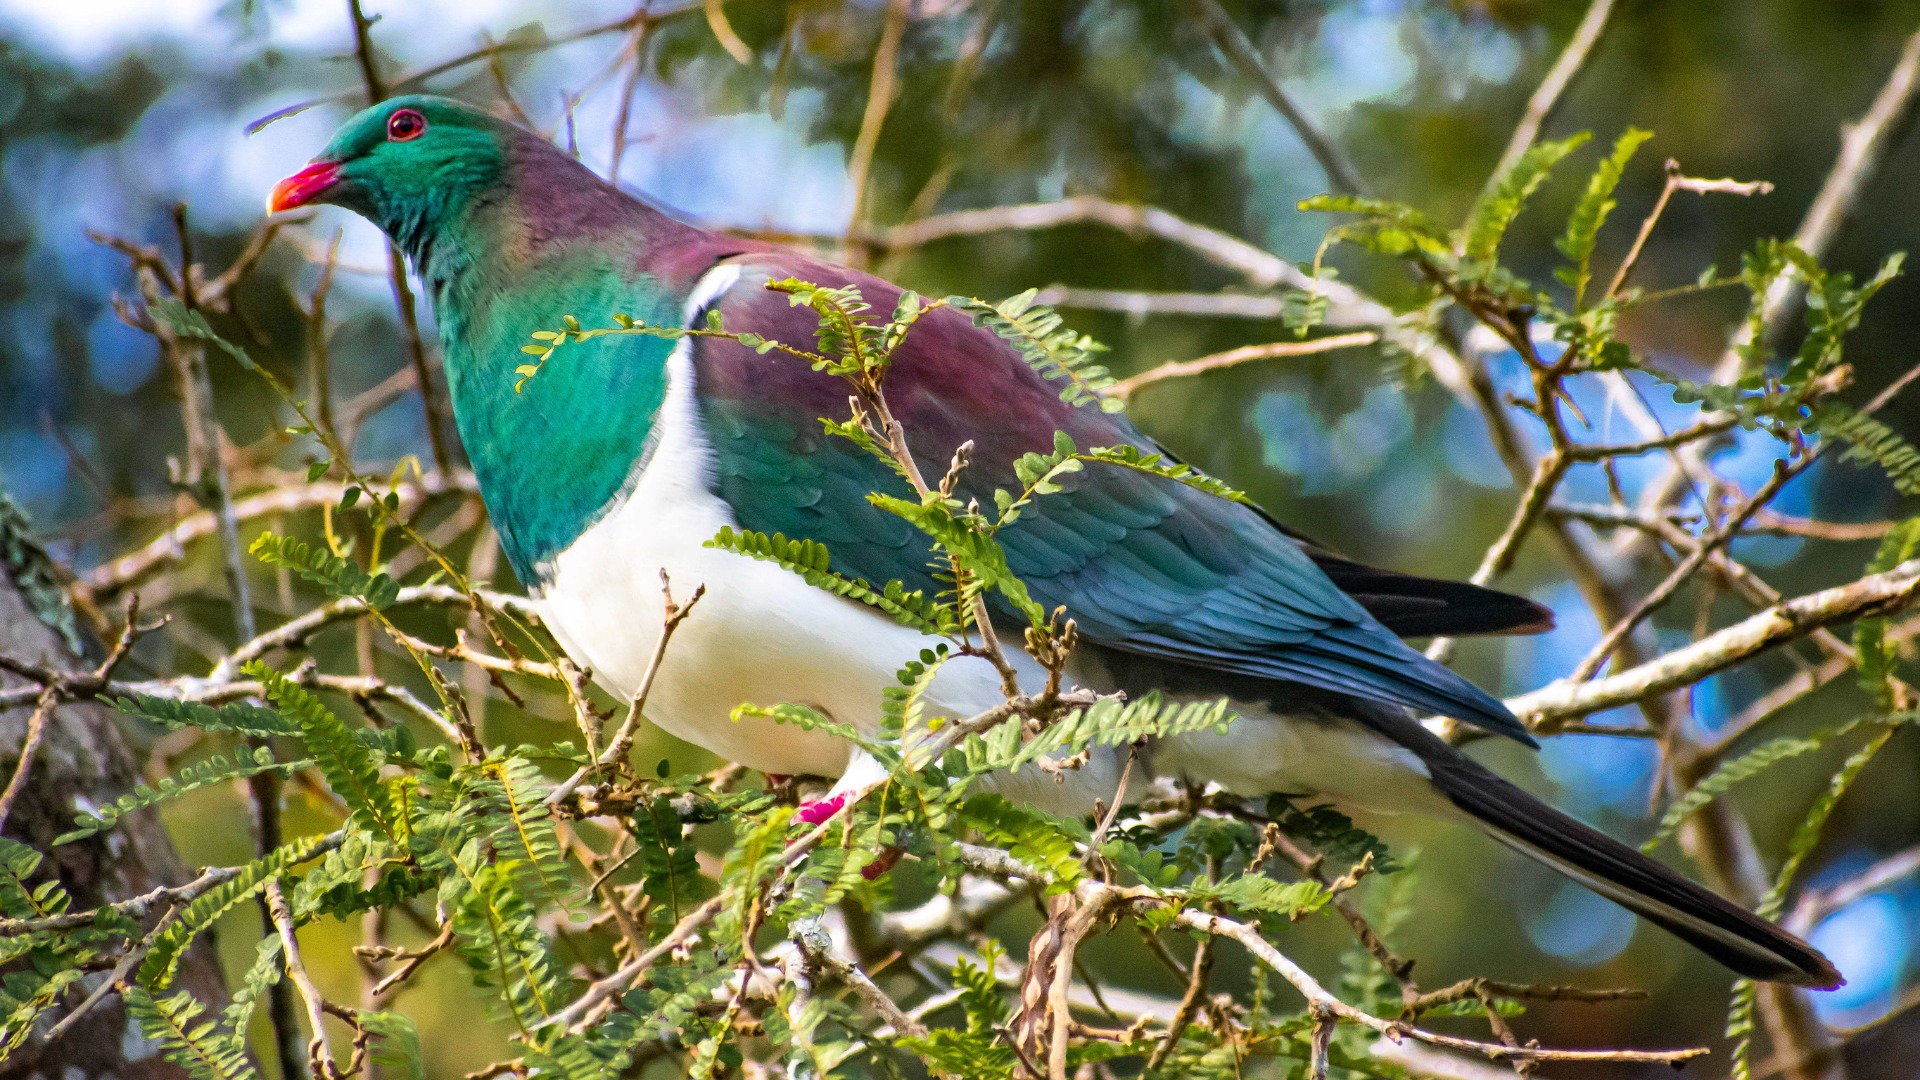
Kererū in kōwhai. Image: Jan Nelson.
Key signals from the 2025 NZ Garden Bird Survey
Results are given as % increase or decrease over the past 5 years (the short term) or the past 10 years (the long term). Visit State of NZ Garden Birds 2025 | Te Āhua o ngā Manu o te Kāri i Aotearoa to find out more.
High quality pdfs of the national and regional reports can be found in the datastore:
State of NZ Garden Birds 2025 |Reports - Dataset - DataStore.
Key signals continue for five native species:
- Kererū counts again show a slow increase over 10 years (16%), but now show a moderate decline over 5 years (22%), compared with a short-term slow decline seen in 2024.
- Fantail (pīwakawaka) counts again show a slow increase over 10 years (31%), with moderate long-term increases in two regions. Their counts remain stable over 5 years (-3%), but with slow short-term declines in three regions.
- We continue to see a slow increase in tūī (kōkō) counts over the long term (19%) and short term (7%). Their regional long-term trends continue to show a rapid increase in Canterbury (198%).
- For the first time, silvereye (tauhou) counts show a slow increase nationally over the long term (16%) and short term (15%).
- Bellbird (korimako) counts over 10 years continue to be stable (5%), but for the first time they show a slow increase over 5 years (9%).
Key signals for introduced species that also act as environmental indicators:
- Myna counts remain stable nationally over 10 years (-1%), with some evidence of a stable trend over 5 years as well (-4%). They show evidence of long-term increases in three regions and short-term increases in two regions.
- Goldfinch counts now show a slow decline over 10 years (16%) and a rapid decline over 5 years (37%), compared with a stable long-term trend and moderate short-term decline seen in 2024.
- For the first time since 2020, dunnock counts are stable nationally over 10 years (1%), with slow to moderate increases in three regions. There is some evidence for a slow increase nationally over 5 years (6%), with moderate short-term increases in three regions.
- Starling and chaffinch counts again show a slow decline over 10 years (11% and 24%, respectively). Similar to last year, chaffinch counts also show a moderate decline over 5 years (18%).